Get wine harvest data by French Region from a pdf#
France Agrimer is one of the Oh-How-Many beaurocratric structures that French taxpayers happily finance. In between others, they do statistics. And with those statistics, they make pdf reports. And one of those reports has numbers I am interested in, here is the link
It has the harvested volume of wine by French wine AOC (think of it as wine regions), from 2009 to 2019.
I tried to find the numbers in a tabular format (excel, CSV…), but with no success. I tried to copy - paste the data, but it was too messy.
I naturally thought: What a great occasion to use python and the tabula-py library (pandas of course)!
The tables I am interested in start at page 96 and end at page 102.
For each wine region, there are 3 lines of information, represented with a letter:
R: RECOLTES –> Harvest –> This is the one we are interested in
S: STOCKS –> Stock
D: DISPONIBILITES –> Availability
For each number, the unit is 1000 hl (100 000 liters or 26,417.2 gallons)
We start by importing the libraries:
# We are going to plot a region, because that is always fun:
import matplotlib.pyplot as plt
import pandas as pd
import tabula
Initiate the instance#
We define:
pdf_file_name: name of the pdf file, in this case it is in the current directory, because, why notstart_pageandend_page: the numbers of the first and last page of the pdf (not the one the document displays at the bottom right, which starts numeration in the 3rd page of the pdf. This is so we can later loop and get all the table data.df_raw_list_first:tabula.read_pdfcreates a list that contains a Pandas DataFrame, with the table found on that pdfcolumn_names: The name of the columns, because (as we will see later), in this case, the pdf is set in a way that tabula does not recognize them. So we will “manually” insert them.
pdf_file_name = "pdf_wine_production.pdf"
start_page = 96
end_page = 102
df_raw_list_first = tabula.read_pdf(pdf_file_name, pages=start_page, encoding="latin-1")
column_names = [
    "AOC",
    "data_type",
    "08/09",
    "09/10",
    "10/11",
    "11/12",
    "12/13",
    "13/14",
    "14/15",
    "15/16",
    "16/17",
    "17/18",
    "18/19",
]
Fix DataFrame columns and add all the tables to the DataFrame#
As we can see, our element df_raw_list_first is a list that contains a DataFrame.
Also, this DataFrame has values, that should be rows, as column names… And the column names are missing (Tabula did not recognize them, and if you look at the pdf, it looks like the header of the table is separated from the main table.
But no worries! We can code a function that will give the good column names and make the current column become a row of data!
As stated before, tabula returns a list, with DataFrame in it, this is why we call df_raw_list_first[0]
df_raw_list_first[0].columns
Index(['APPELLATIONS BLANCHES', 'Unnamed: 0', 'Unnamed: 1', 'Unnamed: 2',
       'Unnamed: 3', 'Unnamed: 4', 'Unnamed: 5', 'Unnamed: 6', 'Unnamed: 7',
       'Unnamed: 8', 'Unnamed: 9', 'Unnamed: 10', 'Unnamed: 11'],
      dtype='object')
def give_good_column_name(df, column_names):
    """
    input: DataFrame where the column names should actually be data in a row and list with the proper column names
    output: A DataFrame with data as data and proper column names
    """
    # First, current "column names" are passed to a list
    column_names_row = df.columns.tolist()

    # Now we give proper column names to the DataFrame:
    df.columns = column_names

    # We create a DataFrame with the former "column names" as lines and the proper column names
    column_df = pd.DataFrame([column_names_row], columns=df.columns)

    # And the we concat both DataFrames:
    df = pd.concat([column_df, df], axis=0)
    df = df.reset_index(drop=True)
    return df
df_raw = give_good_column_name(df_raw_list_first[0], column_names)
df_raw.head()
| AOC | data_type | 08/09 | 09/10 | 10/11 | 11/12 | 12/13 | 13/14 | 14/15 | 15/16 | 16/17 | 17/18 | 18/19 | |
|---|---|---|---|---|---|---|---|---|---|---|---|---|---|
| 0 | APPELLATIONS BLANCHES | Unnamed: 0 | Unnamed: 1 | Unnamed: 2 | Unnamed: 3 | Unnamed: 4 | Unnamed: 5 | Unnamed: 6 | Unnamed: 7 | Unnamed: 8 | Unnamed: 9 | Unnamed: 10 | Unnamed: 11 |
| 1 | BORDEAUX MOUSSEUX/CREMANT | R | 11 | 12 | 10 | 13 | 13 | 14 | 25 | 34 | 50 | 24 | 48 |
| 2 | NaN | S | 11 | 9 | 10 | 8 | 8 | 10 | 9 | 11 | 13 | 23 | 7 |
| 3 | NaN | D | 22 | 22 | 20 | 22 | 21 | 24 | 34 | 45 | 63 | 47 | 55 |
| 4 | CHAMPAGNE | R | 2 811 | 1 809 | 1 332 | 1 904 | 1 933 | 2 575 | 2 481 | 2 238 | 1 929 | 1 958 | 2 258 |
Create a full DataFrame, with information from all pages#
We created a DataFrame with the first page containing the table we want. Now we make a loop to add the others.
# We start at page+1 because we already have the first page.
for page in range(start_page + 1, end_page + 1):
    list_raw_page = tabula.read_pdf(pdf_file_name, pages=page, encoding="latin-1")
    df_raw_page = give_good_column_name(list_raw_page[0], column_names)
    df_raw = pd.concat([df_raw, df_raw_page], axis=0)
Add a column with wine type#
The logic here is that in the pdf file, wines are ordered by wine type, these always appear on top of the concerned wines.
We use the .iterrows() method. It is a very slow function, but:
Our DataFrame is small
This is not an operation we will be doing often (at all)
It is easy even if I am sure there is way better ways to this
df_wine_type = df_raw.reset_index(drop=True)
df_wine_type["wine_type"] = ""
df_wine_type["AOC"] = df_wine_type["AOC"].fillna("")
df_wine_type.head(2)
| AOC | data_type | 08/09 | 09/10 | 10/11 | 11/12 | 12/13 | 13/14 | 14/15 | 15/16 | 16/17 | 17/18 | 18/19 | wine_type | |
|---|---|---|---|---|---|---|---|---|---|---|---|---|---|---|
| 0 | APPELLATIONS BLANCHES | Unnamed: 0 | Unnamed: 1 | Unnamed: 2 | Unnamed: 3 | Unnamed: 4 | Unnamed: 5 | Unnamed: 6 | Unnamed: 7 | Unnamed: 8 | Unnamed: 9 | Unnamed: 10 | Unnamed: 11 | |
| 1 | BORDEAUX MOUSSEUX/CREMANT | R | 11 | 12 | 10 | 13 | 13 | 14 | 25 | 34 | 50 | 24 | 48 |
wine_type = ""
for index, row in df_wine_type.iterrows():
    data_type = row["data_type"]
    if data_type not in ("R", "S", "D"):
        wine_type = row["AOC"]
    # And then we assign the value to the "cell"
    df_wine_type.at[index, "wine_type"] = wine_type
# And then we eliminate the rows
df_wine_type = df_wine_type[df_wine_type["data_type"].isin(["R", "S", "D"])]
df_wine_type = df_wine_type.reset_index(drop=True)
df_wine_type.head()
| AOC | data_type | 08/09 | 09/10 | 10/11 | 11/12 | 12/13 | 13/14 | 14/15 | 15/16 | 16/17 | 17/18 | 18/19 | wine_type | |
|---|---|---|---|---|---|---|---|---|---|---|---|---|---|---|
| 0 | BORDEAUX MOUSSEUX/CREMANT | R | 11 | 12 | 10 | 13 | 13 | 14 | 25 | 34 | 50 | 24 | 48 | APPELLATIONS BLANCHES |
| 1 | S | 11 | 9 | 10 | 8 | 8 | 10 | 9 | 11 | 13 | 23 | 7 | APPELLATIONS BLANCHES | |
| 2 | D | 22 | 22 | 20 | 22 | 21 | 24 | 34 | 45 | 63 | 47 | 55 | APPELLATIONS BLANCHES | |
| 3 | CHAMPAGNE | R | 2 811 | 1 809 | 1 332 | 1 904 | 1 933 | 2 575 | 2 481 | 2 238 | 1 929 | 1 958 | 2 258 | APPELLATIONS BLANCHES |
| 4 | S | NaN | NaN | NaN | NaN | NaN | NaN | NaN | NaN | NaN | NaN | 3 666 | APPELLATIONS BLANCHES |
df_wine_type.tail(2)
| AOC | data_type | 08/09 | 09/10 | 10/11 | 11/12 | 12/13 | 13/14 | 14/15 | 15/16 | 16/17 | 17/18 | 18/19 | wine_type | |
|---|---|---|---|---|---|---|---|---|---|---|---|---|---|---|
| 394 | S | 73 | 45 | 43 | 57 | 68 | 65 | 60 | 55 | 59 | 62 | 35 | NORD - EST | |
| 395 | D | 90 | 58 | 57 | 77 | 81 | 75 | 73 | 70 | 76 | 69 | 63 | NORD - EST |
Complete the names of the AOCs#
Most of the time, the names of the AOCs are in the row where data_type is “R”.
But sometimes, it can be a longer name and tabula assigns it to several rows. This is why we iterate over the DataFrame (again) and assign the names properly.
for index, row in df_wine_type.iterrows():
    if row["data_type"] == "R":
        complete_aoc_name = (
            df_wine_type.at[index, "AOC"]
            + " "
            + df_wine_type.at[index + 1, "AOC"]
            + " "
            + df_wine_type.at[index + 2, "AOC"]
        )
        complete_aoc_name = complete_aoc_name.strip()
        df_wine_type.at[index, "AOC"] = complete_aoc_name
        df_wine_type.at[index + 1, "AOC"] = complete_aoc_name
        df_wine_type.at[index + 2, "AOC"] = complete_aoc_name
df_wine_type.head()
| AOC | data_type | 08/09 | 09/10 | 10/11 | 11/12 | 12/13 | 13/14 | 14/15 | 15/16 | 16/17 | 17/18 | 18/19 | wine_type | |
|---|---|---|---|---|---|---|---|---|---|---|---|---|---|---|
| 0 | BORDEAUX MOUSSEUX/CREMANT | R | 11 | 12 | 10 | 13 | 13 | 14 | 25 | 34 | 50 | 24 | 48 | APPELLATIONS BLANCHES |
| 1 | BORDEAUX MOUSSEUX/CREMANT | S | 11 | 9 | 10 | 8 | 8 | 10 | 9 | 11 | 13 | 23 | 7 | APPELLATIONS BLANCHES |
| 2 | BORDEAUX MOUSSEUX/CREMANT | D | 22 | 22 | 20 | 22 | 21 | 24 | 34 | 45 | 63 | 47 | 55 | APPELLATIONS BLANCHES |
| 3 | CHAMPAGNE | R | 2 811 | 1 809 | 1 332 | 1 904 | 1 933 | 2 575 | 2 481 | 2 238 | 1 929 | 1 958 | 2 258 | APPELLATIONS BLANCHES |
| 4 | CHAMPAGNE | S | NaN | NaN | NaN | NaN | NaN | NaN | NaN | NaN | NaN | NaN | 3 666 | APPELLATIONS BLANCHES |
Fix numeric values#
Numeric value have spaces and there is non-numeric characters.
In this particular case, I am confident that we can replace NaN values by 0, because they represent n
df_wine_type[
    [
        "08/09",
        "09/10",
        "10/11",
        "11/12",
        "12/13",
        "13/14",
        "14/15",
        "15/16",
        "16/17",
        "17/18",
        "18/19",
    ]
] = (
    df_wine_type[
        [
            "08/09",
            "09/10",
            "10/11",
            "11/12",
            "12/13",
            "13/14",
            "14/15",
            "15/16",
            "16/17",
            "17/18",
            "18/19",
        ]
    ]
    .replace(" ", "", regex=True)
    .replace("[^\d]+", 0, regex=True)
    .fillna(0)
    .astype(int)
)
Get the harvest data#
We get the rows where data_type is “R”
df_wine_harvest = df_wine_type[df_wine_type["data_type"] == "R"]
df_wine_harvest = df_wine_harvest.reset_index(drop=True)
df_wine_harvest.head()
| AOC | data_type | 08/09 | 09/10 | 10/11 | 11/12 | 12/13 | 13/14 | 14/15 | 15/16 | 16/17 | 17/18 | 18/19 | wine_type | |
|---|---|---|---|---|---|---|---|---|---|---|---|---|---|---|
| 0 | BORDEAUX MOUSSEUX/CREMANT | R | 11 | 12 | 10 | 13 | 13 | 14 | 25 | 34 | 50 | 24 | 48 | APPELLATIONS BLANCHES |
| 1 | CHAMPAGNE | R | 2811 | 1809 | 1332 | 1904 | 1933 | 2575 | 2481 | 2238 | 1929 | 1958 | 2258 | APPELLATIONS BLANCHES |
| 2 | CLAIRETTE DE DIE | R | 74 | 87 | 87 | 86 | 88 | 94 | 94 | 96 | 87 | 40 | 95 | APPELLATIONS BLANCHES |
| 3 | COTES DU JURA MOUSSEUX/CREMANT | R | 18 | 18 | 18 | 23 | 16 | 15 | 16 | 16 | 20 | 7 | 19 | APPELLATIONS BLANCHES |
| 4 | CREMANT DE BOURGOGNE | R | 133 | 129 | 117 | 118 | 113 | 146 | 167 | 151 | 147 | 148 | 138 | APPELLATIONS BLANCHES |
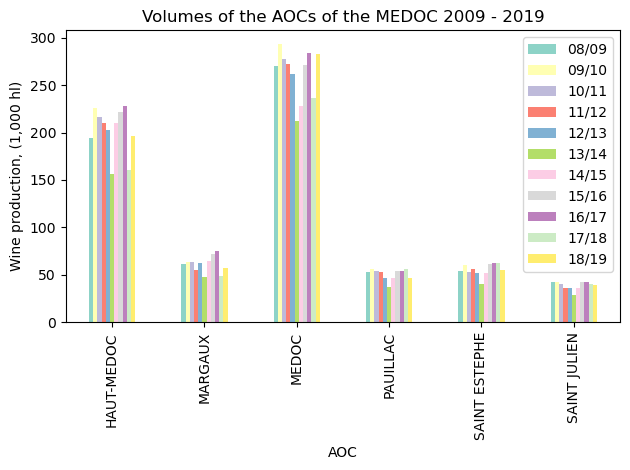
# Increase the figure size (width, height) in inches
plt.figure(figsize=(10, 5))
ax = df_wine_harvest[
    df_wine_harvest["AOC"].isin(
        ["HAUT-MEDOC", "MEDOC", "MARGAUX", "PAUILLAC", "SAINT ESTEPHE", "SAINT JULIEN"]
    )
].plot.bar(x="AOC", colormap="Set3")

plt.ylabel("Wine production, (1,000 hl)")
plt.title("Volumes of the AOCs of the MEDOC 2009 - 2019")

plt.tight_layout()
plt.savefig("medoc_wine_production.png", dpi=300)
plt.show()
<Figure size 1000x500 with 0 Axes>
Saving the dataset.#
We use df.to_csv to create a CSV file with our data.
The CSV file can be found here
df_wine_harvest.to_csv("wine_harves_france_aoc_09_19.csv", index=False)